期货现货价差小工具
这个小工具是基于天勤量化(TqSdk)利用现货最新价减去期货主连最新价,来帮助用户实时得到实时最新差价信息,具体实现源码在文章最后。
而天勤量化则是信易科技既快期系列后新推出的期货 Python 量化开发包,目前提供vs code 插件版运行,和直接使用 TqSdk这个开发包来运行
天勤量化的优势
相比专有语言,天勤量化更灵活,本质上是一个 Python 的第三方开发包,只需要 pip install tqsdk 即可运行,拥有专有语言无法比拟的自由度,能实现它们难以轻松达成的套利策略等,更可以配合 Python其他丰富的第三方拓展包来实现更多可能性
相比网页版的 Python平台,我们觉得我们是更安全的,自己赚钱的代码托付给网页的云服务器,难免有卧榻之侧岂容他人鼾睡之感。另外我们的自由度也是更高的,我们支持全国130余家的期货公司登陆,同时可以自由自在使用自己喜欢的IDE进行编程
相比其他开源 Python平台,我们入门更简单,具体框架机制也更科学,功能也更强大,点击查看我们和其他框架具体区别,同时我们也有被评价为“开源平台里最详细的开发文档和支持最及时的用户论坛”
另外,我们还提供免费的交易通道和历史行情数据,没有任何手续费上浮,如果你已经心动了,现在可以选择先了解 天勤量化(TqSdk)开发包
期货现货价差小工具的实现
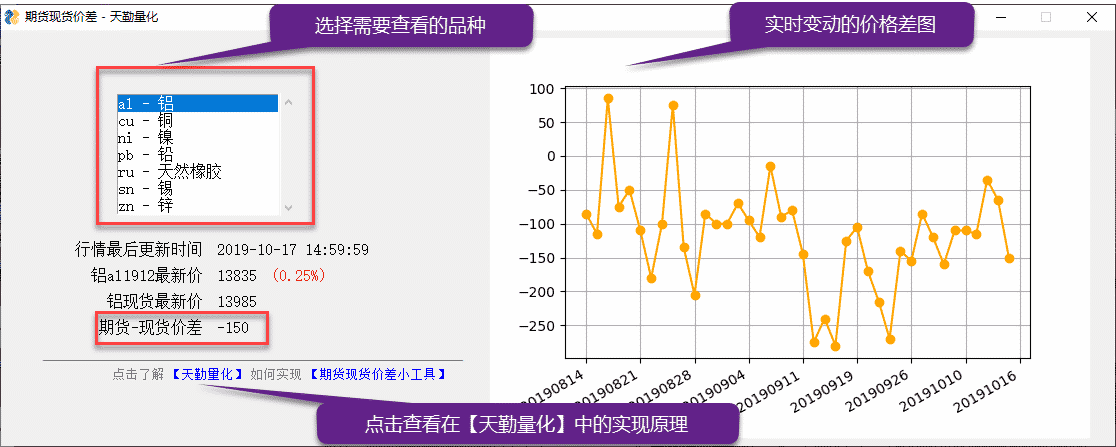
小工具的实现具体要让TqSdk配合其他扩展库来使用,分别是GUI库搭配使用,另外一个是生成独立的应用程序,配合 Pyinstaller 使用,如果你已经有较为不错的 Python基础,那么我们相信,实现起来一定不是难事,实现之后的效果图展示如下
期货价差小工具实现源码
#!usr/bin/env python3
#-*- coding:utf-8 -*-
"""
@author: yanqiong
@file: futures_spot_spreads.py
@create_on: 2019/9/27
@description: 演示如何使用 Tqsdk 计算期货和现货价差,并使用 GUI 界面展示
    除了 Tqsdk 还需要提前安装的工具包 :
    PySimpleGUI (https://pysimplegui.readthedocs.io/en/latest/)
    matplotlib (https://matplotlib.org/)
    mplcursors (https://mplcursors.readthedocs.io/en/stable/index.html)
"""

import sys
import math
import asyncio
import numpy as np
import pandas as pd
import PySimpleGUI as sg
import webbrowser
import matplotlib
import matplotlib.pyplot as plt
import matplotlib.ticker as ticker
import mplcursors
matplotlib.use('TkAgg')
from matplotlib.backends.backend_tkagg import FigureCanvasTkAgg, NavigationToolbar2Tk

from tqsdk import TqApi

DataLength = 40 # 显示最近10日价差
IndexList = np.arange(DataLength)

# ------------------------------- TqSdk Helper Code -------------------------------
links = {
     "_LINK_":  "https://www.shinnytech.com/blog/futures-spot-spreads/",
     "_TITLE_": "https://www.shinnytech.com/tianqin/#utm_source=pc-customer&utm_medium=banner&utm_campaign=little-instrument"
}

def open_link (url = 'https://www.shinnytech.com/tianqin/'):
    webbrowser.open_new(url)

def get_product_name (product_id):
    return product_id.split(' - ')[1]

def get_quote_sn (symbol):
    return symbol.split('.')[1]

# ------------------------------- Tqsdk 业务代码 -------------------------------
loop = asyncio.get_event_loop()
api = TqApi(loop=loop)

# 现货、期货合约对应列表
SymbolDict = {
    "al - 铝": ["SSWE.ALH", "KQ.m@SHFE.al", "orange"],
    "cu - 铜": ["SSWE.CUH", "KQ.m@SHFE.cu", "deepskyblue"],
    "ni - 镍": ["SSWE.NIH", "KQ.m@SHFE.ni", "red"],
    "pb - 铅": ["SSWE.PBH", "KQ.m@SHFE.pb", "lightseagreen"],
    "ru - 天然橡胶": ["SSWE.RUH", "KQ.m@SHFE.ru", "olive"],
    "sn - 锡": ["SSWE.SNH", "KQ.m@SHFE.sn", "burlywood"],
    "zn - 锌": ["SSWE.ZNH", "KQ.m@SHFE.zn", "deeppink"]
}
for i in SymbolDict:
    symbol = api.get_quote(SymbolDict[i][1]).underlying_symbol
    SymbolDict[i].append(symbol)
    SymbolDict[i].append(get_quote_sn(symbol))
ProductList = list(SymbolDict.keys())
SelectedProductId = ProductList[0] # 默认选择的品种

klines_series = [[api.get_kline_serial(SymbolDict[i][0], 86400, DataLength), api.get_kline_serial(SymbolDict[i][3], 86400, DataLength)] for i in SymbolDict]
def prepare_data (product_id) :
    ind = ProductList.index(product_id)
    return pd.to_datetime(klines_series[ind][1]["datetime"] / 1e9, unit='s', origin=pd.Timestamp('1970-01-01')), klines_series[ind][1]["close"] - klines_series[ind][0]["close"]
dt_series, spread_series = prepare_data(SelectedProductId)

# ------------------------------- Matplotlib Code -------------------------------
fig, ax = plt.subplots()
fig.set_size_inches(6, 4)

def format_date(x, pos=None):
    if pos is None:
        return dt_series[int(x)].strftime("%Y%m%d")
    else:
        ind = np.clip(int(x + 0.5), 0, DataLength - 1) # 保证下标不越界
        return dt_series[ind].strftime("%Y%m%d")
ax.xaxis.set_major_formatter(ticker.FuncFormatter(format_date)) # 格式化 X 轴显示

def prepare_plot():
    if dt_series[0] == dt_series[1]:
        return
    [spread_min, spread_max] = [np.min(spread_series), np.max(spread_series)]
    padding = (spread_max - spread_min) * 0.05
    ax.set_ylim(spread_min - padding, spread_max + padding)
    lines = ax.plot(IndexList, spread_series, "o-", color=SymbolDict[SelectedProductId][2])
    c2 = mplcursors.cursor(lines, hover=True)
    @c2.connect("add")
    def _(sel):
        ann = sel.annotation
        ann.get_bbox_patch().set(fc="#DBEDAC", alpha=.5)
        date_text = ann.get_text().replace('x=', 'date: ').split('\n')[0]
        i = math.floor(sel.target[0])
        ann.set_text("{}\n spread: {}".format(date_text, math.floor(spread_series[i])))
    ax.grid(True)
    fig.autofmt_xdate()

fig = plt.gcf()  # if using Pyplot then get the figure from the plot
figure_x, figure_y, figure_w, figure_h = fig.bbox.bounds

# ------------------------------- Matplotlib helper code -----------------------
def draw_figure(canvas, figure):
    figure_canvas_agg = FigureCanvasTkAgg(figure, canvas)
    figure_canvas_agg.draw()
    figure_canvas_agg.get_tk_widget().pack(side='top', fill='both', expand=1)
    return figure_canvas_agg

def draw_toolbar(canvas, root):
    toolbar = NavigationToolbar2Tk(canvas, root)
    toolbar.update()
    canvas._tkcanvas.pack(side='top', fill='both', expand=1)
    return

fig_canvas_agg = None

# ------------------------------- PySimpleGui Task Code  -----------------------
async def gui_task():
    global SelectedProductId, dt_series, spread_series, fig_canvas_agg
    # 获取合约引用
    quote_spot = api.get_quote(SymbolDict[SelectedProductId][0])
    quote_future = api.get_quote(SymbolDict[SelectedProductId][3])
    # 界面布局
    fontStyle = 'Any 12'
    layout = [
              [
                  sg.Frame(
                  title='',
                  font='Any 12',
                  border_width=0,
                  size=(40, 12),
                  layout=[
                      [sg.Listbox(values=ProductList, default_values=[ProductList[0]], enable_events=True, select_mode=sg.LISTBOX_SELECT_MODE_SINGLE, size=(20, 7), pad=((80, 0), (0, 20)), font='Any 12', key="_PRODUCT_")],
                      [
                          sg.Text("行情最后更新时间", size=(20, 1), font=fontStyle, justification="right"),
                          sg.Text("-------", size=(20, 1), font=fontStyle, key="datetime")
                      ],
                      [
                          sg.Text(get_product_name(SelectedProductId) + SymbolDict[SelectedProductId][4] + "最新价", size=(20, 1), font=fontStyle, justification="right", key="future.name"),
                          sg.Text("期货报价", font=fontStyle, key="future.last"),
                          sg.Text("期货涨跌幅", font=fontStyle, key="future.change")
                      ],
                      [
                          sg.Text(get_product_name(SelectedProductId) + "现货最新价", size=(20, 1), font=fontStyle, justification="right", key="spot.name"),
                          sg.Text("仓单报价", font=fontStyle, key="spot.last")
                      ],
                      [
                          sg.Text("期货-现货价差", size=(20, 1), font=fontStyle, justification="right"),
                          sg.Text("差价", size=(20, 1), font=fontStyle, key="spread")],
                      [sg.Text('_' * 60, text_color="grey")],
                      [
                          sg.Text("点击了解", font='Any 10', text_color="grey", size=(18, 1), pad=(0,0), justification="right"),
                          sg.Text("【天勤量化】", font='Any 10', text_color="blue", auto_size_text=True, pad=(0,0), key='_TITLE_', enable_events=True),
                          sg.Text("如何实现", font='Any 10', text_color="grey",  auto_size_text=True, pad=(0,0)),
                          sg.Text("【期货现货价差小工具】", font='Any 10', text_color="blue",  auto_size_text=True, pad=(0,0), key='_LINK_', enable_events=True)
                       ]
                  ],
                  relief=sg.RELIEF_SUNKEN,
                  tooltip='Use these to set flags'),
                  sg.Canvas(size=(figure_w, figure_h), key='canvas')
              ]
            ]
    window = sg.Window('期货现货价差 - 天勤量化', layout, finalize=True)
    # 在 canvas 处绘制图表
    prepare_plot()
    fig_canvas_agg = draw_figure(window['canvas'].TKCanvas, fig)
    # toolbar_canvas_agg = draw_toolbar(fig_canvas_agg, window.TKroot)


    while True:
        event, values = window.Read(timeout=0)
        if event == "_PRODUCT_":
            if SelectedProductId != values[event][0]:
                SelectedProductId = values[event][0]
                dt_series, spread_series = prepare_data(SelectedProductId)
                if len(ax.lines) > 0: ax.lines.pop()
                prepare_plot()
                fig_canvas_agg.draw()
                window.Element('spot.name').Update(get_product_name(SelectedProductId) + "现货最新价")
                window.Element('future.name').Update(get_product_name(SelectedProductId) + SymbolDict[SelectedProductId][4] + "最新价")
                window.Element('future.change').Update("()")
                # 更新合约引用
                quote_spot = api.get_quote(SymbolDict[SelectedProductId][0])
                quote_future = api.get_quote(SymbolDict[SelectedProductId][3])
        elif event == "_LINK_" or event == "_TITLE_":
            open_link(links[event])
        if event is None or event == 'Exit':
            sys.exit(0)

        # 更新界面数据
        window.Element('datetime').Update(quote_future.datetime[:19])
        window.Element('spot.last').Update('nan' if math.isnan(quote_spot.last_price) else int(quote_spot.last_price))
        window.Element('future.last').Update('nan' if math.isnan(quote_future.last_price) else int(quote_future.last_price))

        future_change = (quote_future.last_price - quote_future.pre_settlement) / quote_future.pre_settlement * 100
        if math.isnan(future_change):
            window.Element('future.change').Update("(nan)", text_color = "black")
        else:
            window.Element('future.change').Update(
                "({}%)".format(round(future_change, 2)), text_color="red" if future_change >= 0 else "green")

        spread = quote_future.last_price - quote_spot.last_price
        window.Element('spread').Update('nan' if  math.isnan(spread) else int(spread))
        await asyncio.sleep(0.001)  # 注意, 这里必须使用 asyncio.sleep, 不能用time.sleep

loop.create_task(gui_task())

# ------------------------------- TqApi Task Code  -----------------------
while True:
    api.wait_update()